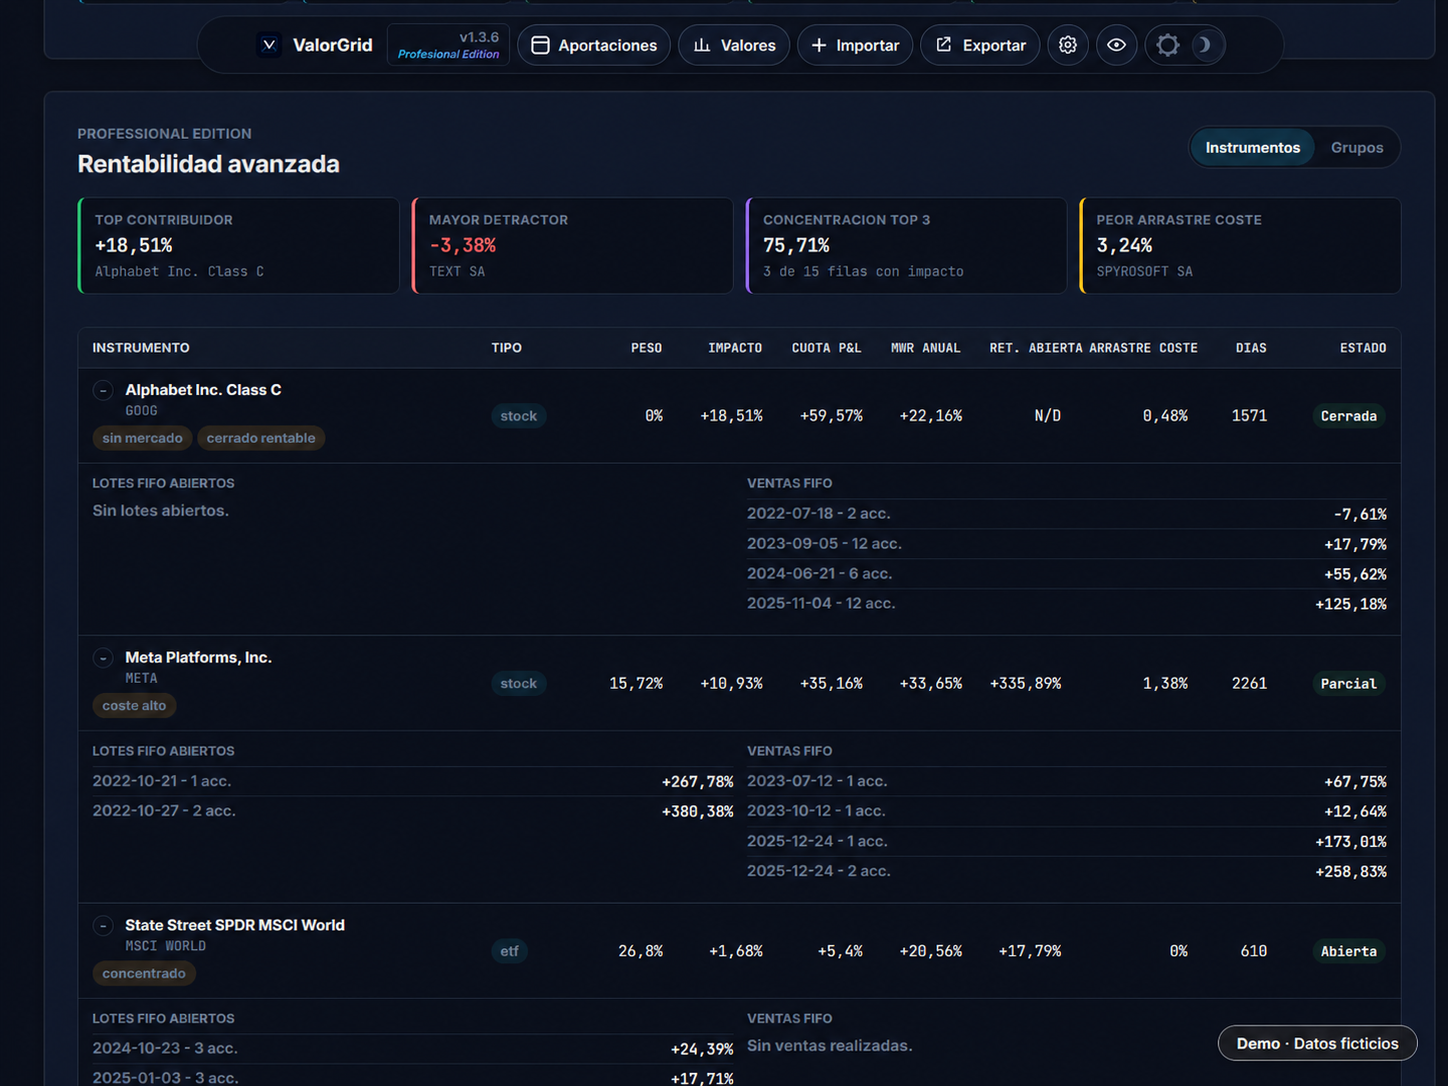
Advanced performance by instrument and group
Portfolio impact, P&L share, annualized MWR, cost drag, top-3 concentration, open FIFO lots, and realized sell events. Collapsible rows with bulk expand/collapse and show-more controls for long lot lists. Toggle between per-instrument view and aggregated group attribution.
Imports from compatible brokers
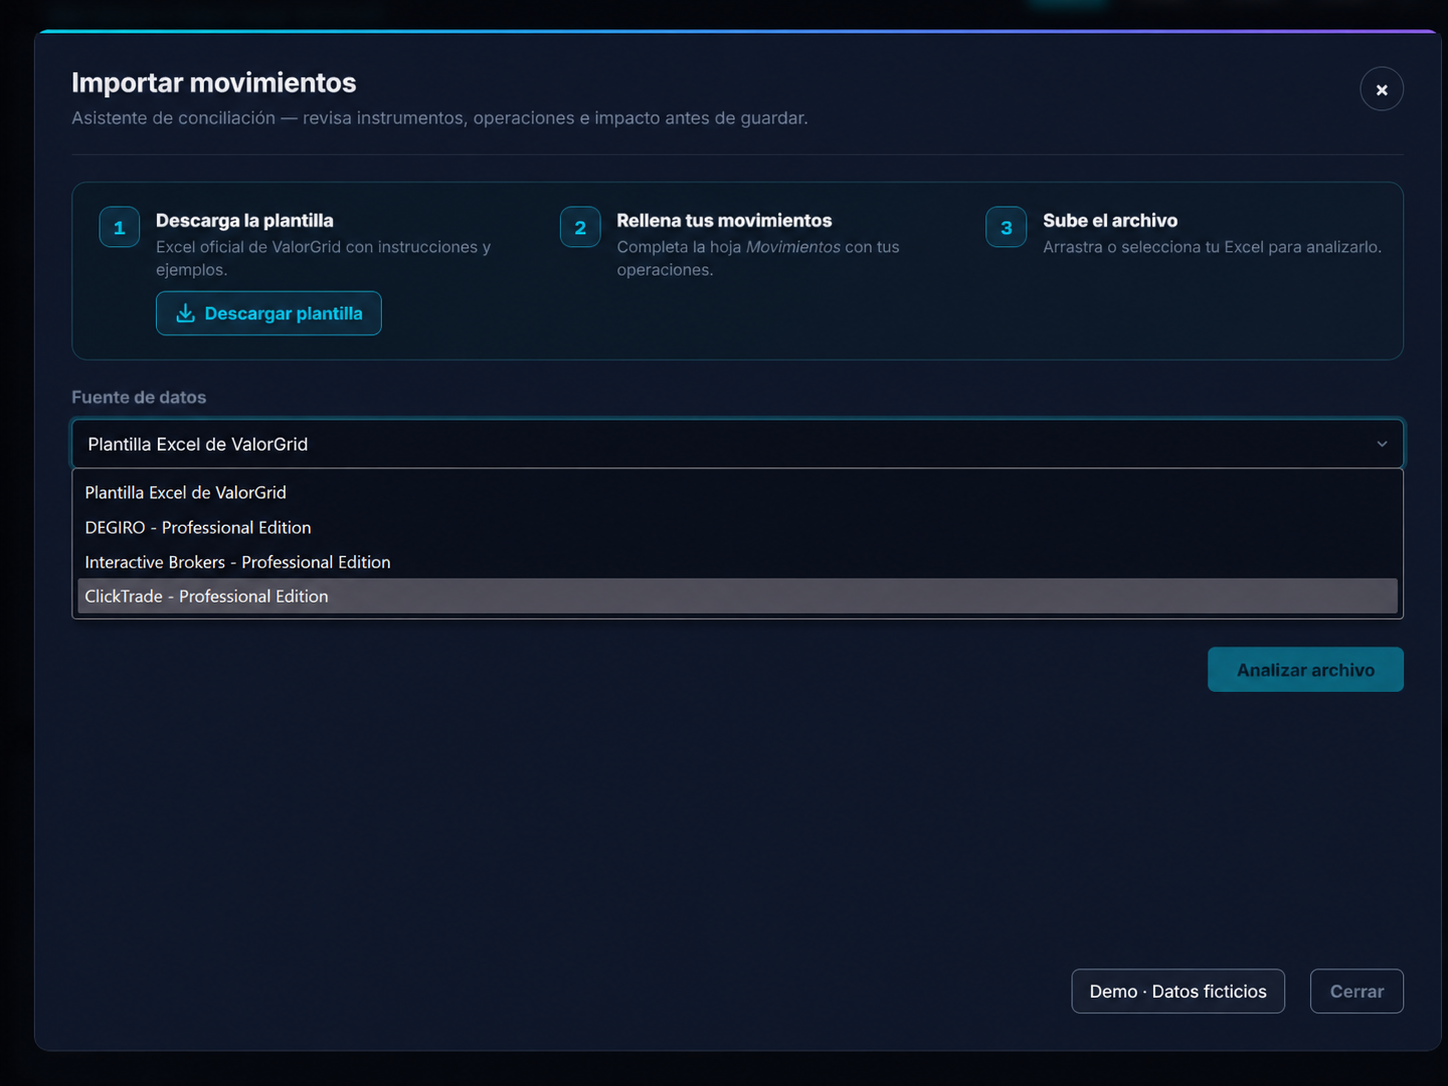
Import your trade history from Excel files exported by DEGIRO, Interactive Brokers, and ClickTrade. No API connections or channels — you export the file and ValorGrid processes it locally.
MyInvestor is included in PRO 1.9.0.
Freedom24 and Trade Republic are future, subject to collaborators and anonymized exports.
Your broker not listed? Suggest it.
Configurable operations
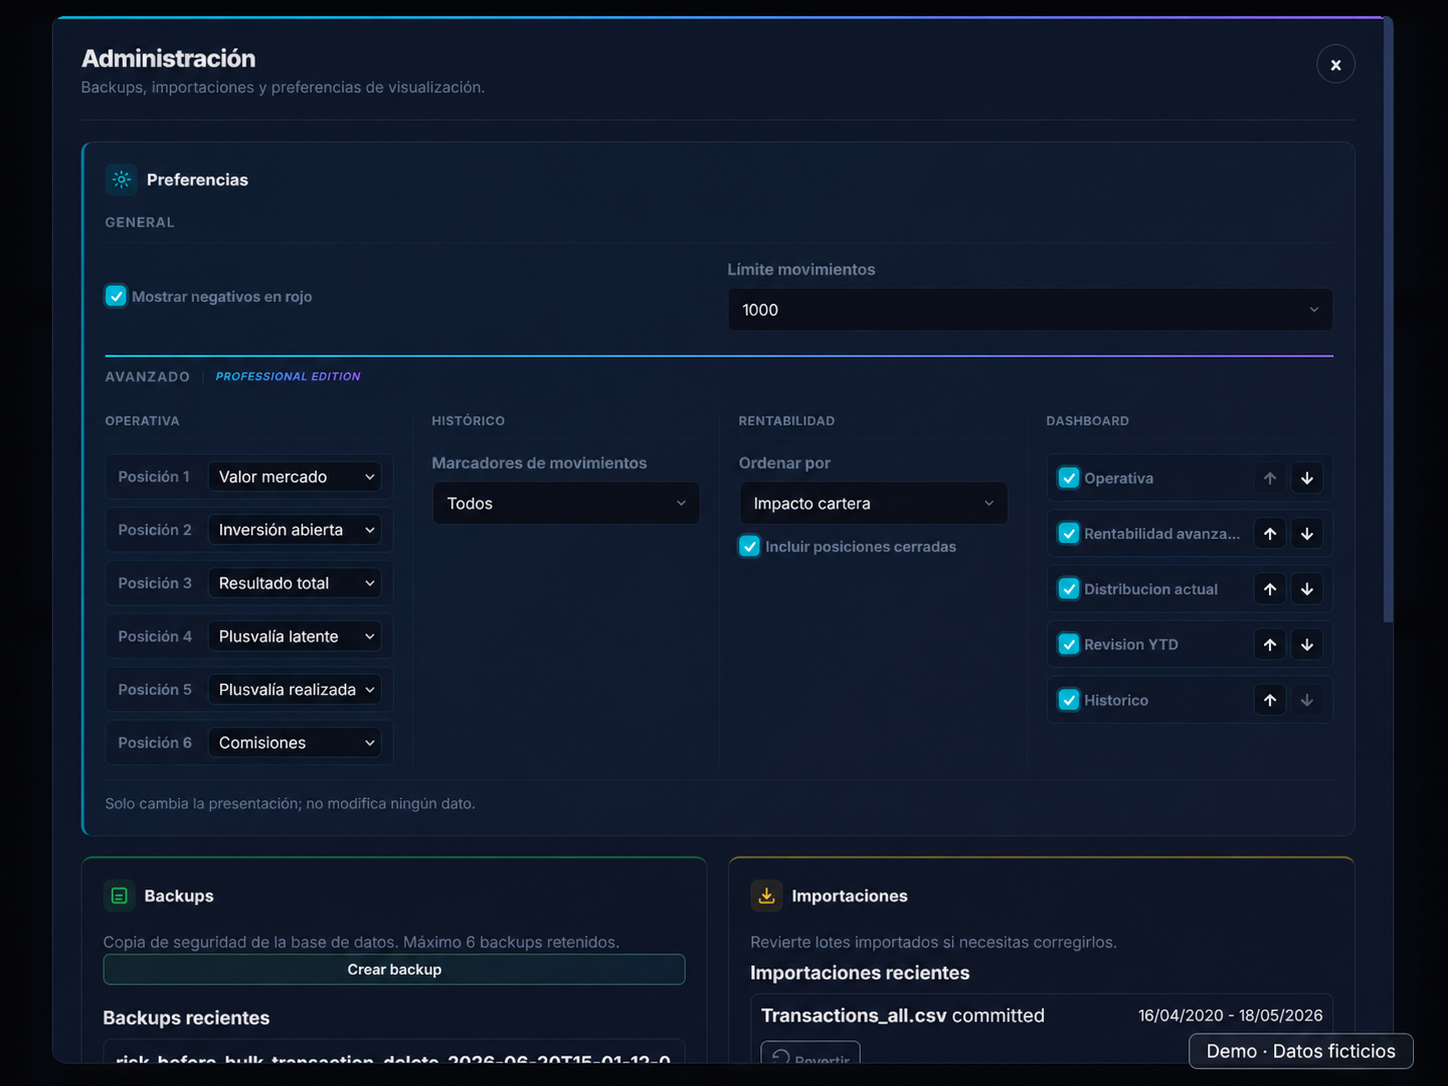
Choose and reorder 6 KPI cards on the dashboard from 15 available metrics: market value, net contributed, total return, latent gain, realized gain, fees, simple return, number of transactions, average commission, open investment, net cash flow, gross buys, gross sells, dividend income, and dividend count.
Corporate actions and stock splits
Automatic split detection via Yahoo Finance with integer 1:N/N:1 ratios. Historical position reconciliation, technical split handling, and safe schema recovery on existing databases.
Chart Studio
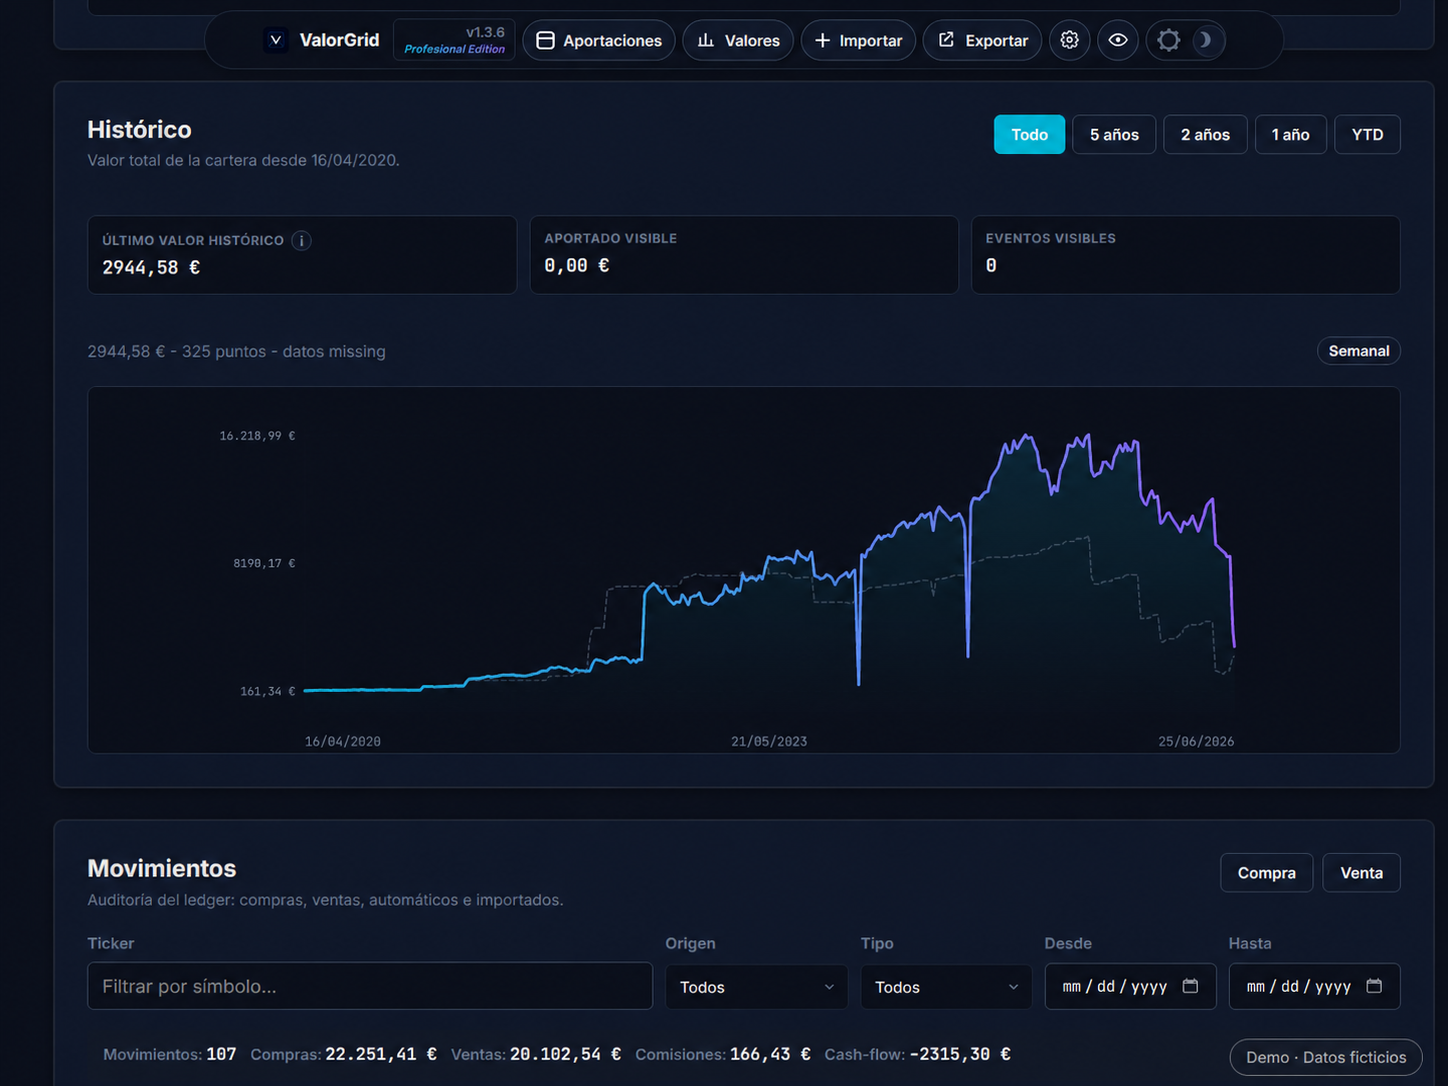
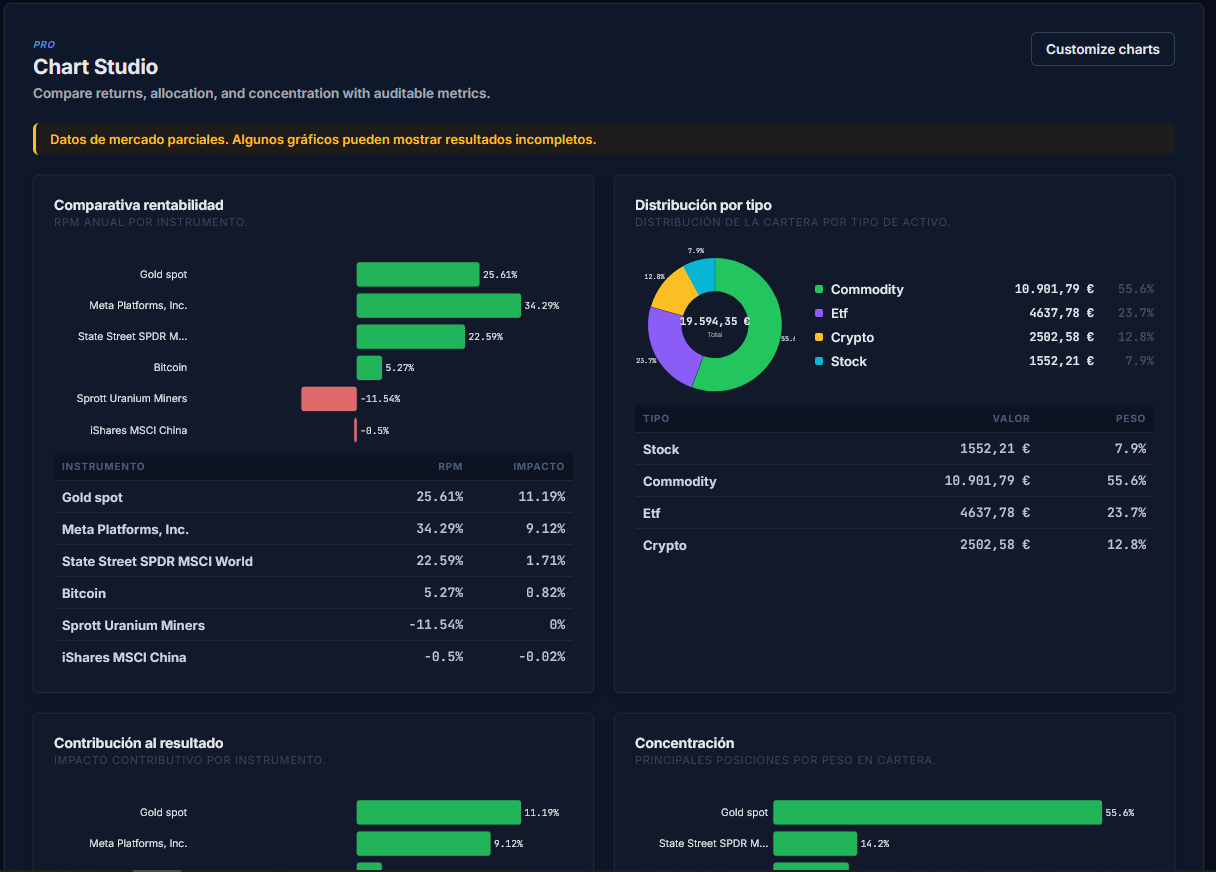
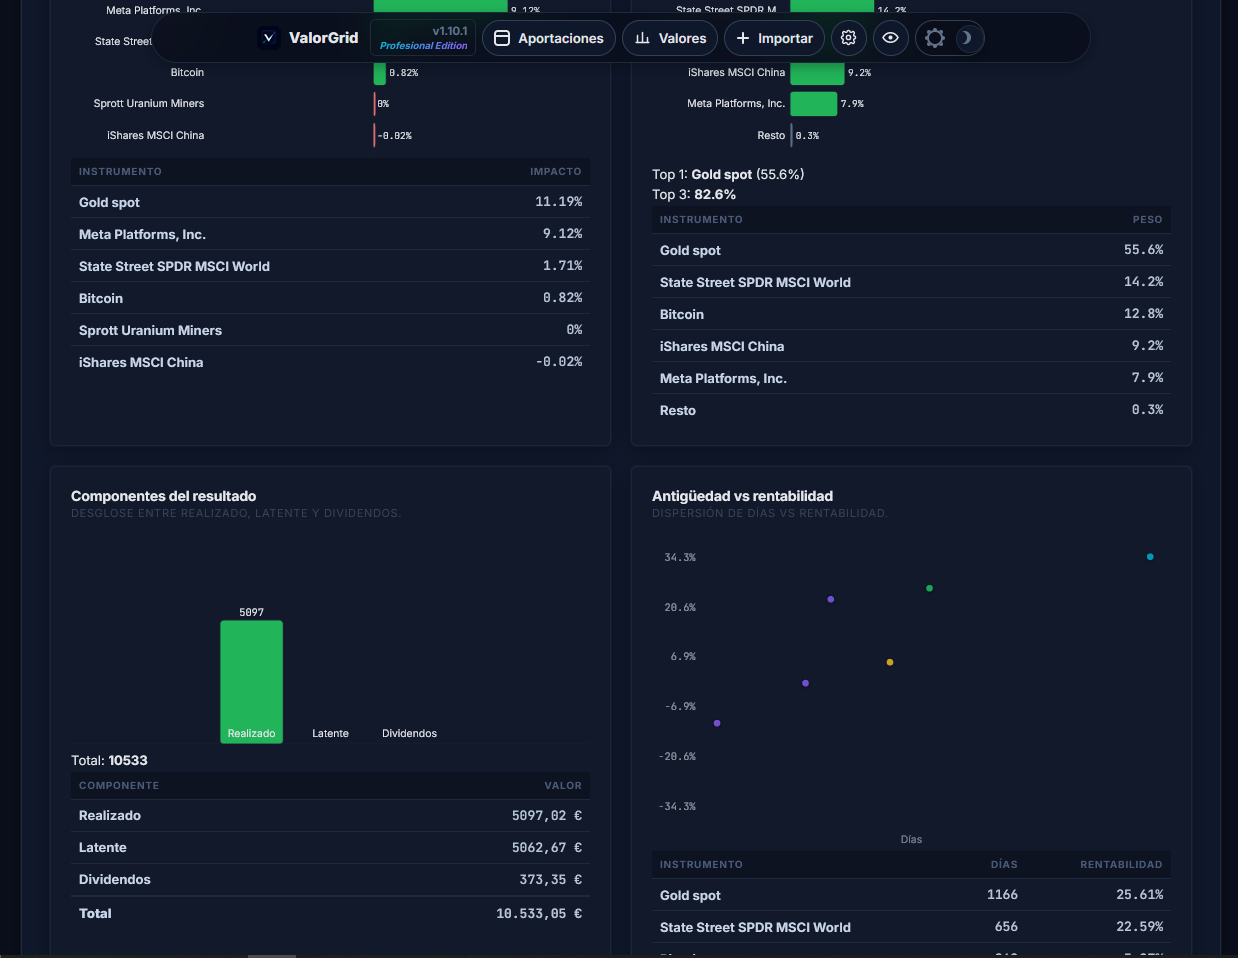
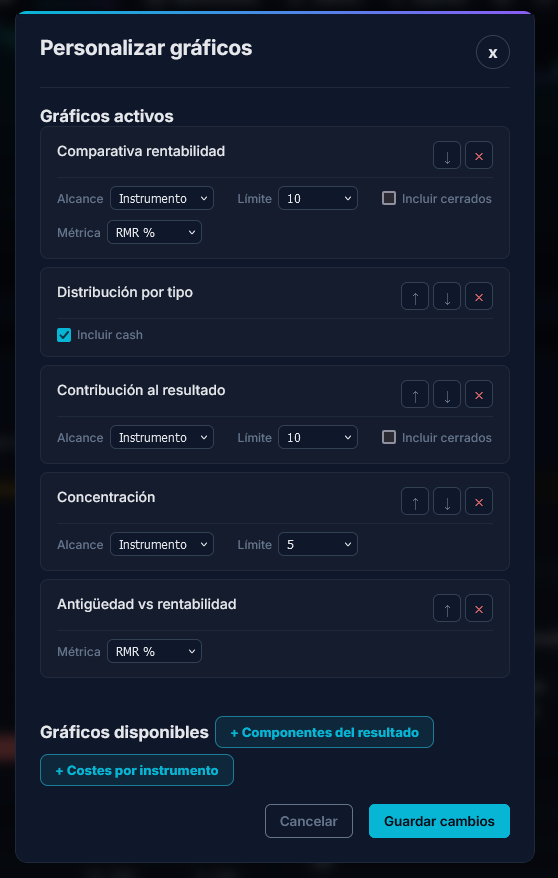
Chart editor to customize your portfolio visualization: metric selection, time range, chart type, group aggregation, scope, limit, and inclusion of closed positions and cash.
Persistent preferences
Dashboard block order, operations metrics, history filters, and transaction notes are saved to the database. They travel with backups and are restored on every session.
PRO license with 30-day trial
Free 30-day trial through a signed license. When it ends, activate the PRO license by pasting a signed JSON from the app's UI.